To Estimate or #NoEstimates, that is the Question

The bard ponders #NoEstimates with some real data

Chris Verhoef and I decided to look for some real project data to explore the value of software estimates and #NoEstimates. We have submitted our research as an article to IEEE for peer review. The complete paper can be found here, and some highly related materials on our prior and ongoing estimation research (M.U.S.E.) can be found here. The following is a summary of the paper.

Abstract:  A common approach in agile projects is to use story points, velocity and burnup charts to provide a means for predicting release date or project scope.  Another approach that is proposed is to abandon story point estimation and just count stories using a similar burnup chart.  We analyzed project data from 55 projects claiming to use agile methods to investigate the predictive value of story point estimation and velocity for project forecasts.  The data came from nine organizations ranging from startups to large multinational enterprises. We found that projections based on throughput (story counts) were essentially identical to that of using velocity (story points).  Neither velocity nor throughput were great predictors as the uncertainty bands were rather large.  Through the use of a simulation model we replicated our findings which aid in understanding the boundary conditions for when story point estimates may be better predictors.

Key Findings

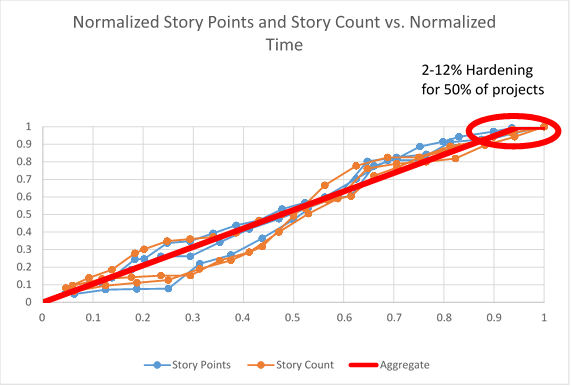
The first thing we noticed was that the normalized burnup charts for Story Points (Velocity) and Story Count (Throughput) were nearly identical. One interesting thing we also found was that roughly 50% of the projects plateaued and required from 2-12% of the total time to finally conclude. We associate that with a probable hardening and/or release readiness period. It is useful to recognize this so that teams can plan accordingly.

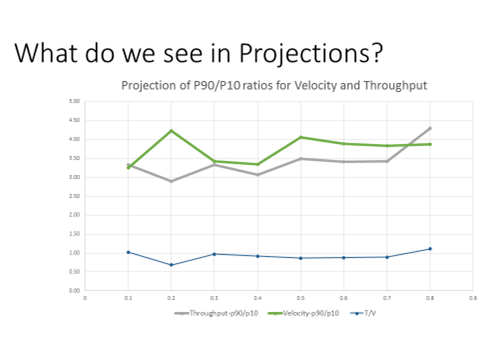
So the next thing we looked at was the projection of release date based on the remaining story points using average velocity, or story count using average throughput. To compare the approaches we looked at the P90/P10 ratio as an indicator of range. This ratio is commonly used in domains where the range of the distribution is rather large.  The P90 is the 90th percentile and P10 is the 10th percentile. Some domains where it is used frequently are wealth distributions and oil and gas exploration.  As a concrete example, the P90/P10 ratio for income inequality is, roughly speaking, the ratio of what professionals like doctors and lawyers earn to what cleaners and fast food workers earn. One of the nice attributes of the P90/P10 ratio is that it uniquely describes the distribution shape for either a lognormal or Weibull distribution.

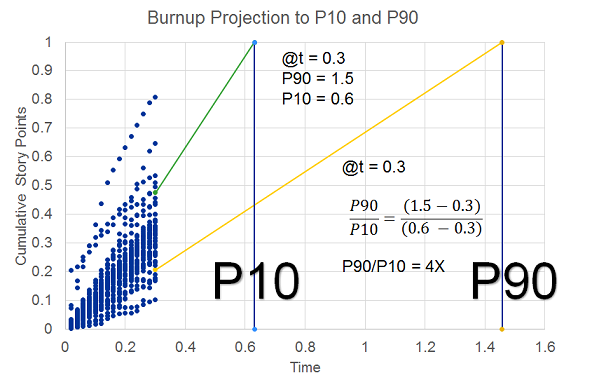
At each iteration we made projections based on the remaining work using the average velocity and throughput.  This is a standard approach in agile projects and is mathematically identical to extrapolation using traditional project management Earned Value Management (EVM). We compare these projections against the known actuals to determine the relative errors.  The figure below shows the burnup chart for all projects plotted on the same axis scale.  In this particular case we have data through t=0.3. Then using the velocity thus far we project out the anticipated release date.  The error in the projection is the delta from 1.0.  On this same figure we show the P90 and the P10 projections.  To determine the actual error bands we subtract out the current projection time (t=0.3).  For this chart (with approximations to simplify the math) we have P90 of 1.5, and P10 of 0.6.  The revised P90 and P10 are 1.2 and 0.3 respectively, which gives a P90/P10 ratio of 4.0.

What we discovered was that there was almost no difference in the accuracy band of the velocity projections relative to the throughput projections. In fact the throughput projections were marginally better than the velocity projections. In both cases we found that the accuracy of the projections did not improve as a function of time, consistent with our prior findings about the Cone of Uncertainty [Little] [Eveleens and Verhoef]. Neither velocity nor throughput are particularly good predictors, however, with a P90/P10 ratio on the order of 3.5. In practical terms, whether using velocity or throughput, if a team forecasts that they have about 6 months remaining, the P10 to P90 bands for 80% confidence are roughly 3.2 to 11.2 months. This does not bode well for teams or stakeholders that are expecting estimates that are commitments or even within 25% accurate.

In addition to looking at the raw data, we built a Monte Carlo simulation to explore the impact of Story Point Distribution, Estimation Accuracy, Hardening time, and Estimation Bucketing Approach. We started with the empirical curves from the data and also tried lognormal and Weibull curve fits. The data showed a correlation between Story Points and velocity which we also incorporated in the simulation.  We were able to achieve a very good match to the data with overall P90/P10 ratios near 3.5. Once we had this base we were able to run some sensitivity analysis to see what situations resulted in velocity providing improved projections. The simulations showed throughput projections to be essentially identical to velocity projections.  One might think that improved estimation accuracy would favor velocity.  While velocity projections are improved, the throughput projections are equally improved.  The only time we found an advantage to using velocity was when the range of story point distribution is very large.  This is good news as the team has a lot to say about how they split their stories so as to reduce the range of the story distribution.

Based on these findings, we made some observations about the implications on critical decisions that teams and organizations make.

Decisions to steer towards the release We observed from both the data and the simulations that story point estimates provide minimal improvement in forecasting compared to using throughput for typically observed estimation accuracy. If story point estimates are very accurate (unlikely) then they may provide value. The simulations showed that estimates may also help when there is a large range of story distribution, although an alternative approach would be to split large stories so that the overall distribution is not large. When estimating a container of mixed nuts, we don’t really care too much whether we have smaller peanuts or larger brazil nuts, but we do want to spot any coconuts!
Decisions to help with managing iterations Many teams use detailed task estimation to help them manage their iterations. We did not have access to task estimations for this study, however the findings with story points should be very enlightening. Task estimation and tracking can often be a very time consuming activity. Teams should look at how much value they are getting from these estimations.
Decisions at project sanction Some level of macro-estimation of costs and benefits is likely necessary for business decisions. If the benefits are so overwhelming that it should be done at any cost, then it could be wasteful to spend time on estimating something that does not impact the decision. In general it is waste to spend more time on cost estimation than on benefits. In fact, a study of a number of projects at a major organization found that value generated was negatively correlated to cost forecast accuracy. Too much emphasis on cost or on reduction of uncertainty can destroy forecasting accuracy of value predictions.

When estimating a container of mixed nuts, we don’t really care too much whether we have smaller peanuts or larger brazil nuts, but we do want to spot any coconuts!

Practitioner’s Guide

Velocity vs. Throughput

With the typically observed story point estimate accuracy range, our results show there is minimal added value to using velocity over using throughput for estimating purposes. When story size distribution is very large, then velocity has better predictive power than throughput.

Hardening

In about half the projects there was a period at the end of the project of between 2-12% of the overall timeline with zero velocity, most likely for release and hardening activities. Unless teams have reasons to believe that they will not require such activities, we recommend either allocating a corresponding time buffer or adding stories (and story points if used) for such activities.

Estimation Accuracy

This study provides additional confirmation that the range of uncertainty with software estimation accuracy is significant and we can confidently say that this range of uncertainty is much larger than many decision makers realize.  An interesting finding was that improvements in estimation accuracy helped throughput projections just as much as velocity projections. So while improving estimation accuracy may be a noble goal it is not a reason to favor velocity over throughput.

Bucketing of Estimates

While there was some degradation of the predictive power of velocity as buckets get very large, the overall impact is still very small. Since bucketing approaches are used for expediting estimation processes this finding suggests that teams may continue to use them should they find value in estimating at all. However, we have seen situations where religious adherence to bucketing approaches slowed down or distorted the estimation process and in those circumstances teams may be better suited with simpler approaches. Bucketing or #NoBucketing? You decide.

Uncertainty over Time

Perhaps a bit more bad news for teams and decision makers is that it doesn’t get better over time. The range of relative uncertainty of the work left to be done is large and stays large over time, which is consistent with other findings regarding the Core of Uncertainty.

Decisions

Decisions are being made at multiple levels. For some decisions there may be value to estimates of stories or story points. But those estimates most likely have very large uncertainty ranges. The important question for the team is to understand the decisions they care about, and to comprehend the range of uncertainty to make the appropriate decisions. Decision makers would be wise to learn more about making decisions under uncertainty. There is significant research in many other industries (e.g oil and gas exploration, financial institutions, actuaries, etc.)

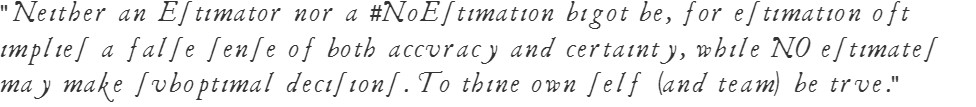
Estimates or #NoEstimates

To paraphrase Polonius’ advice to Laertes,


Posted in Uncategorized | 6 Comments

The Cost of Delay and the Cost of Crap

I’ve noticed a lot of people in the agile and lean communities lately talking about the Cost of Delay. I think it is a great idea (I wrote about the concept in an article in IEEE Software “Value Creation and Value Capture” and again in our book “Stand Back and Deliver.”). But as much as I like love the idea, I hate the name. Why? If there are two things that the software industry is obsessed with it is cost and delay. However, “cost of delay” is really not really about cost — it is about value loss. I’ve run across people that have diligently calculated the cost of delay as the actual costs that would be incurred by having the development team work longer. It is true that these costs are part of cost of delay, but that is totally missing the big aspect of cost of delay which is the value lost due to delay. That is why I would prefer to call it “Value Lost from Delay.” I recognize that adding a 4th word makes it much less desirable. Plus, cost is such a loaded word, partricularly in IT. I’m resigned to Cost of Delay being here to stay, but at least when you hear that phrase think “Value Lost from Delay.”

So given this first cognizant dissonance, how do we actually use the Cost of Delay? Typically, rather than calculating a number, I prefer looking at patterns of behavior. The following picture illustrates 3 different patterns showing value loss as a function of time. In curve C, the value does not drop off rapidly and the value loss from delay is a combination of the time value of money, the actual incremental costs, and the relatively small amount of market loss from the delay. This is contrasted with curve A where the value drops precipitously once the deadline passes. Examples of this include major events such as the Olympics or a conference. Other cases where value may drop off significantly, but perhaps not drop to zero include seasonal items such as games during the Christmas season.

So this chart gives us an indication of the value loss (or cost) due to the impact of missing the target delivery date. Our tendency is to treat everything as if it matches the “A” pattern. Invariably, when I have had mature conversations with stakeholders I find that only a few projects are really “A” and far more are actually “C”. That is one important realization. But what else is missing from this conversation? What about the creation of value in the first place? After all, what is more important: getting it right, or getting it done on time?

I once worked at an organization that was a market leader and had gotten to that position by extreme focus on strategy, customer, and quality. The only problem was that they had some challenges with meeting the aggressive schedules that they set. A new leader came in and was committed to changing that. He could have it all, including and most importantly having it on time. What did the organization do? Of course they shipped on time. But features and quality were not up to the usual high standards. What was the reaction from our customers? They coined the term “CRAP ON TIME!” Not the type of ringing endorsement that you want from your customers.

What’s missing from the Cost of Delay discussion is the COST OF CRAP! Using my own logic from above, I should be calling this the Value Lost from Crap. But I know better. Cost of Crap is much catchier. Not only is it shorter but it has alliteration!

What are some other examples of the Cost of Crap?

FORD Taurus

From Aaron Shensar from the Stevens Institute in “Strategic Project Leadership – Toward a strategic approach to project management

The first generation of Ford Taurus turned out to be the best-selling car in America in the late 1980s. Conceived in the early 1980’s and introduced in 1985, it used a unique standard for project management and product development. It took full advantage of cross-functional teams and concurrent engineering practices; established close ties with vendors and subcontractors, and was characterized by a strategic spirit of focusing on customer needs and strong synergy with the business. The result was a remarkable business success, and customers simply loved the car. Yet, when the project was completed, the project manager was fired. The reason was that project completion was late by three months.

In contrast, the second generation of Ford Taurus was developed in the early 1990s and completed in 1996. With increased competition and the remarkable success of Japanese imports, Ford had hoped to reestablish Taurus, once again, as the best-selling car in America. But the new project manager learned the lesson of his predecessor: He considered project schedule as the most important criteria, and made sticking to schedule the ultimate goal, while sacrificing other issues. Vendor relationships, team spirit, and product integration were just few of the things that had suffered. The second generation of Taurus turned out to be a disappointing business experience. Although the project was completed on time, it did not recapture the position of the best-selling car in America and Ford was not able to repeat its outstanding success of the first Taurus (Walton, 1997).

WinWord 1.0

Winword 1.0 is often cited as an example of very poor software estimation and execution. The original plan in 1984 called for a delivery in 1 year. The project ended up taking 5 years before it commercially shipped. Certainly they had a ridiculously ambitious schedule. They had huge uncertainties as they were entering into a new market space for Windows based word processing with a technology base (Windows) that was constantly evolving under them. Those that were setting the aggressive target were probably doing so by calling out something akin to the Cost of Delay – “if we don’t get out to the market within 1 year we will lose our market opportunity.” Well, 5 years later they came out with a product in a market strongly dominated by an entrenched competitor (Word Perfect) with about 50% market share, and in a very short period of time became the dominant market leader. What would have happened if they had come out with an inferior product in order to avoid the cost of delay? Market acceptance would likely have been negligible. The cost of delay would be meaningless because there would have been little to no revenue to lose. Instead, by waiting until the product was sufficient to meet core customer needs they were able to generate substantial value. Stan Liebowitz of the University of Texas looked at the market share of Word vs. WordPerfect since 1986. Was Winword 1.0 a failed project because it was 4 years late? I would contend that the value gain from delay was enormous compared to what would have happened from shipping an inferior product. Perhaps the cost of delay was negative?

Rain Delay

My good friend and book partner Kent McDonald had this story to offer up.

I had some roof damage from a hail storm in May. We didn’t realize it until a roofing company (let’s call them Blackstone) came by trolling for business and told us we probably had damage.  They said call our insurance and they would mark the roof when the adjustor came out.

Adjustor came out, and suggested a different roofing company (let’s call them Petticord) which is part of their Preferred Vendor Network. Even though Blackstone pointed out that we had damage, and also said they would do the job for less than their own estimate or the insurance estimate (this raised red flags) we went with Petticord because the insurance company (let’s call them Allied Insurance) would work directly with Petticord, and it would be fairly low effort for us. When I told Petticord that we were going with them, I asked when they may get to it. I asked merely for information.  They said the next week.

On Friday, I got home from Des Moines and there were packages of shingles on my roof.  Petticord called and said they were going to try and get it done over the weekend or Monday.  I commented that would be good, but I wasn’t in an all fired hurry and asked if they were sure they wanted to be doing roofing in the rain.  All weekend and Monday there were several storms forecast.

On Monday (forecast 80% chance of severe thunderstorms) a roofing crew shows up at our house and starts pulling shingles off and putting shingles on.  About 1:30 in the afternoon, a wicked storm blows through blowing the shingles the roofers had just put down and causing several leaks in our house. Upon talking to people at Petticord and after listening to all their excuses, they basically took a risk that bad weather wouldn’t hit us (we were looking at the radar all day, we have advanced technology) because they felt schedule pressures.  Not from me mind you.

Now they are having to spend even more time at my house to fix more than just the roof because they took an unnecessary risk to try and stay on an unrealistic schedule.

There are many, many other examples of the “Cost of Crap:” Healthcare.gov, Windows Vista, Windows 8.0 are certainly a few cases where consumer reaction was not positive. So, while there is value to understanding the “Cost of Delay”, there is even more value to understanding the “Cost of Crap.”

Posted in Uncategorized | 1 Comment

The Testing Diamond and the Pyramid

This posting is about the challenges of testing applications and building quality in with a solid testing strategy. All good software engineers know that they should be writing units tests, but still due to a number of reasons they don’t do it. Sometimes it is because they just don’t know how to write them, and sometimes it is because they are just damn lazy. They figure that their job is to be a developer and write the code, and it is the testers’ job to find their errors or to develop automation tests for them. Good developers don’t accept that premise. Good developers take pride in their work and collaborated with the testers to create a system that minimizes the probability of defects.
We typically divide tests into 3 categories: unit tests to test at a fine grain, integration tests to test the integration of multiple units, and end-to-end tests which are typically executed via a user interface.
Naresh Jain, posted a nice blog on “Inverting the Testing Pyramid.” Here’s a short summary.

Most software organizations today suffer from what I called the “Inverted Testing Pyramid”. They spend maximum time and effort building end-to-end GUI test. Very little effort is spent on building unit/micro tests. Hence they end up with majority (80-90%) of their tests being end-to-end GUI tests. Some effort is spent on writing so-called “Integration test” (typically 5-15%.) Resulting in a shocking 1-5% of their tests being unit/micro tests.

Why is this a problem?

The base of the pyramid is constructed from end-to-end GUI test, which are famous for their fragility and complexity. A small pixel change in the location of a UI component can result in test failure. GUI tests are also very time-sensitive, sometimes resulting in random failure. To make matters worse, most teams struggle automating their end-to-end tests early on, which results in huge amount of time spent in manual regression testing. It’s quite common to find test teams struggling to catch up with development. This lag causes many other hard-development problems. Number of end-to-end tests required to get a good coverage is much higher and more complex than the number of unit tests + selected end-to-end tests required.

What I propose and help many organizations achieve is the right balance of end-to-end tests, acceptance tests and unit tests. I call this “Inverting the Testing Pyramid.” [Inspired by Jonathan Wilson’s book called Inverting The Pyramid: The History Of Football Tactics].

Alister Scott takes this one step further by adding a Manual testing cloud to the top of the automation pyramid.
Now if the automation pyramid is inverted, the resulting picture is that of an ice cream cone.→
Ice cream cones might look appealing, but this is an anti-pattern for test strategy.


The Testing Diamond

A few years back I wrote up an experience report about some of the work that we did with a complex engineering application and the focus that we had on increasing overall test coverage. The team ended up with a testing model that more resembles a diamond.
They had a large developer regression suite that provides end to end integration coverage under the GUI. They also had a customer regression suite that handles much more complicated integration problems. They did not have a large GUI automation suite or a large number of unit tests. Over time the team did add more unit tests and more GUI automation, but the real value came from expanding the integration test suite. The result was a substantial reduction in defects found in beta and at ship. The strength of this middle layer is quite key and as Mike Cohn says, it is often the forgotten layer of the pyramid.
When I met up with Naresh at the 2012 Simple Design and Testing conference in Houston he told me the story of Inverting The Pyramid: The History Of Football Tactics. I had already heard about Inverting the Testing Pyramid, but had not heard of the connection to soccer. It dawned on me that in the game of soccer, the successful teams are those that are able to control the midfield.
I think it is the same way with integration tests. While it is certainly true that integration tests are more costly than unit tests, it is also true that integration is the place where the real business value is. Unit tests are often insufficient. The nature of the engineering simulation problem that we were solving is such that the solution of the whole system of equations is necessary to see the full interplay of the complex physics being simulated. Unit tests cannot easily handle issues associated with round off or approximation methods.
Posted in Uncategorized | 1 Comment

The ABCs of Software Requirements Prioritization

One of the best and simplest approaches I have used to help teams get clarity and focus around feature prioritization has been to categorize each feature by an A/B/C prioritization. Using this approach can help provide the balance necessary to allow tradeoffs of scope and schedule while accounting for the inherent uncertainty that is present in software projects. We categorize all the desired features into three priority levels:

A MUST be completed in order to ship the product and the schedule will be slipped if necessary to make this commitment.
B Are WISHED to be completed in order to ship the product, but may be dropped without consequence.
C Are NOT TARGETED to be completed prior to shipping, but might make it if time allows.

The key is that only “A” features are committed, although we expect many of the “B” features will also be delivered. In order to manage the uncertainty we recommend that only 50% of the schedule is filled with “A” features. If more than 50% of the schedule is allocated to “A” features it is a strong indicator that the project delivery target may be at risk.

When teams follow the general guidance, they are positioned to be able to adjust to both the uncertainty associated with the original estimates as well as the uncertainty associated with the project scope. The following example shows a common scenario where the overall estimates were close to the actual, but where discovery of the scope resulted in a movement of some “C” features to be prioritized higher than some of the “B”s, and where there were new “D” features that were viewed as important but had not even considered when the original plan was established.

Priority Target Allocation Typical Result
A 50% 50%
B 50% 25%
C Not in target 12.5%
D Not known at time of target 12.5%

However, what happens when the original estimates were significantly underestimated. The selection of 50% as the maximum allocation for commitments is not arbitrary. Multiple studies of software project estimation have shown a 2X range of uncertainty to be the norm.

Priority Target Allocation Worst Case Result
A 50% 100%
B 50% 0%
C Not in target 0%
D Not known at time of target 0%

This simple approach has worked well to establish expectations and allow teams to meet those expectations. With regard to expectations, it is important to manage the expectations of the “A” features. Since these were promised to stakeholders it is critical that prior to dropping any of these features expectations must be reset with the stakeholders.

This approach is quite similar to the MoSCoW model, but I prefer the ABC model for a couple of key reasons. First, I think it is simpler. I joked once at a DSDM conference (where MoSCoW is very prevalent) that the ABC approach was “MoSCoW for preschoolers.” But I think it is even more powerful due to the specific action consequences that are spelled out by the ABC approach. MoSCoW just states that the Must Haves are necessary for project success, whereas with this ABC model we explicitly call out that the feature is so critical that the release will be delayed in order to complete the feature. I also find that the use of “Should” is loaded.  It gives the connotation that if they are not delivered the team fell short.  I far prefer “Wishes” as I see that category as more like a Christmas Wish list–we’ll likely get some of them, but probably won’t get all of them.

Posted in Uncategorized | Leave a comment

The Context Leadership Model

The Context Leadership Model shown below is a model that I have written about in an Agile2004 Experience Report, IEEE Software and in the book “Stand Back and Deliver: Accelerating Business Agility” (Free Chapter or Amazon) The following post is a short section extracted from my Agile2012 Experience Report.

Over the years I have used the model to look at projects based on the degree of uncertainty and complexity.

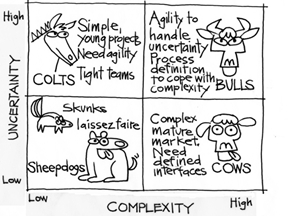
  • Complexity includes project composition such as team size, geographic distribution and team maturity.
  • Uncertainty includes both market and technical uncertainty.


    The four quadrants are named with metaphorical animals

Sheepdogs Simple projects with low uncertainty
Colts Simple projects with high uncertainty
Cows Complex projects with low uncertainty
Bulls Complex projects with high uncertainty

Let’s look at a collection of projects that comprised the overall release of a complex engineering simulation application suite.

Component Quadrant Team Size Iteration Length Standup
User Interface Front End Sheepdog 5 Iterationless 2/week
New Graphical Output Colt 7 1 week 1/day
3D Visualization Sheepdog 2 1 week 1/day
High Performance Computing Simulator Cow 14 3 weeks 3/week
Overall Bull 28 3 weeks none

The Front End team, while globally distributed was nonetheless fairly small and as well had very well defined tasks necessary for the update from the legacy simulator to cover the new functionality. With low uncertainty, generally low complexity and a senior team leader, we let the team largely manage themselves.

The New Graphics was a new product and was looking to provide a solution that no other commercial product currently solved. This meant that it had high uncertainty. The team was relatively small, although globally distributed. The senior developers were collocated in Houston with 2 remote developers and a tester in Romania. The product manager was in Houston and his proactive involvement was critical. To get the product started he developed a user story board. The graphical description of the results he was looking for worked very well to communicate with both the local and the remote team. Of course the pictures were just an invitation to a further conversation. The team relied heavily on the product manager and he made sure to spend time with each of the senior developers typically daily and often several times per day. The remote team was managed independently by one of the senior developers and communicated as necessary via email and phone conversations with a minimum of a weekly synch up meeting.

The 3D Visualization team was enhancing and maintaining an existing application with a team of two developers and one primary tester. This project had some overlap with the New Graphics project so we simply merged the teams together in Scrum meetings.

The simulator team was by far the largest team but was all collocated within Houston. The simulator is the core engine and must coordinate with the other supporting applications. The product had been under development and in the market for several years and the focus was on displacing legacy applications. The gap was relatively well know so uncertainty was moderate and the general complexity put it into the cow category. As a result we settled on a longer iteration length of 3 weeks. The team started with daily standups, and while they found value in the standups they felt that the nature of their R&D work fit better with standups every other day. The team adjusted and continued to deliver in a highly effective manner.

The overall system of systems required managing all of the uncertainty and even more complexity. The total team size was such that we did not feel the need for a Scrum of Scrums model. Instead, we had two ScrumMasters that covered all of the projects, and essentially had them pair to cover the overall release. Each ScrumMaster had primary accountability for a couple of teams, and the other participated in key Scrum meetings for those projects that they did not have direct responsibility. In that way both of them were up on the overall program and knew what cross team issues needed to be resolved. This model worked quite well as not only did the cross team communications happen efficiently, but when one of the ScrumMasters was out we had the other one help out without missing a beat.

Posted in Uncategorized | Leave a comment

The Purpose Alignment Model

I often see teams struggle with aligning their development approaches with the market strategy of how their product is going to be successful in the marketplace. To be successful, a product must do something really well that solves a particular set of problems that customers are willing to pay for while at the same time it needs to solve other basic problems no worse than the competition. Product teams need to know where they are aiming to be “differentiating” and where they are aiming to be “good enough.” The Purpose Alignment Model developed by Niel Nickolaisen is a simple tool that can provide guidance to teams.


Niel suggests looking at a 2×2 matrix, with the Y –axis indicating where you aiming to have true market differentiation (high) or where differentiation is either not possible or simply not a focus of the organization (low). The X-axis asks how Mission Critical it is.

Those items which are Highly differentiated in the market and which are Mission Critical are Differentiating for the organizations.

There are items which are Mission Critical, but which do not differentiate from the competition. For those items we say we aim for Parity with the competition.

Some items may not be Mission Critical for the organization to own, but still create differentiation in the market place. For those items we can look to Partner with someone to create an overall differentiated offering.

Lastly, there are items which are neither Differentiating nor Mission Critical. We need to ask ourselves why these are even being considered. We call these items Who Cares and challenge proponents of these features to justify the movement into one of the other quadrants.

Let’s take a look at an Example using Apple Computer and how they have been successful:


Apple has always prided itself on its ability to come up with new products that emphasize design and overall user experience. These are areas where they have consistently excelled. Over time they got into content distribution with iTunes and the App Store. These as well provided them with differentiation.

While in the early days Apple was based on Motorola chips, over time they realized that they were no longer differentiated and actually behind the market. First they recognized a need to have Microsoft Office on the Apple platform and made an arrangement to be on par with Windows. Similarly they made the switch to Intel hardware as well to keep up.

In the early days of the iPhone Apple knew that they had a competitive differentiator but also saw an opportunity to create a differentiated partnership with ATT. Apple had no need or ability to have their own cellular network, but created a differentiated partnership that provided value to both Apple and ATT.

Lastly, there are some areas that effectively became commodities such as printers and other peripherals. Apple used to have their own line, but it no longer makes sense.I will leave you with a few questions to ponder:

  • Do you know how your product is differentiated in the market?
  • Are you treating some features as though they are differentiated but just need to be at parity?
  • Are you working on features that are really neither differentiated nor mission critical?
Posted in Uncategorized | Leave a comment

Collaborating with Non-Collaborators

I recently came to the realization that often the issue that we face when talking about who we label as non-collaborators often has more to do with whether they agree with us or not.  When someone agrees with us, we either assume they are collaborating or we really don’t care because they are complying with our desires. 

This led me to a simple 2×2 matrix of mapping collaboration against agreement.

  • If someone wants to collaborate and is in general agreement with us, the atmosphere is collegial and we often call those people friends.
  • If they don’t really collaborate, but agree with us nonetheless, then they are in compliance and not real obstacles.
  • if they are non-collaborators and also often in disagreement with us, they oppose us and will often be combative.  This is the category of non-collaborator that causes us the most challenges.
  • in my experience the most interesting situation occurs when there is active collaboration but sufficient disagreement .  This combination can be quite powerful as it generates a creative tension from the occasional conflict.

Focusing on the non-collaborating disagreers, what I see most often is an attempt to move the disagreers to the left into compliance, or to remove them altogether to keep team harmony.  

What can be far more powerful is to work to move them upwards towards collaboration and to work with the creative tension to generate more innovation.

So how do we do this?

The first step is to look at why there is no collaboration.  Most likely it is because they have no desire to work with people that don’t agree with them.  Things get even worse if the experience that they have is being pushed to the left towards agreement.  They feel that they are being ganged up on and that their opinion is not valued.  Why would they want to collaborate?   

That is why it is so important to show respect for all opinions.  Only through respect is it possible to build a culture of trust.  One key element of respect is that of listening.  If someone does not feel that they are being heard, how can they feel  that their views are being respected?

While it is possible to innovate without diversity, it is far too easy to fall into the groupthink trap.  A diverse environment with a culture of trust and respect will generate the creative tension that powers innovation and value generation.

Which brings us back to the complying non-collaborator.   Why are they not collaborating?  Quite possibly they aren’t feeling that collaboration is worth their effort.  Maybe they generally agree with the direction but not sufficiently to risk their own personal safety.  Perhaps they have something to offer but realize that it is not fully aligned with the group.  In an environment without respect and safety it is very easy to shut these people down.  Since they generally comply we write them off as non-collaborators.    But it may be our loss as they may have something useful to offer.

Update: Kent McDonald and I took this blog posting and created an article for ProjectConnections here

Posted in Uncategorized | 2 Comments

Selling Agile to Your Team and Upwards

I’m often asked by passionate agile champions how to help sell agile within their company.  Selling Agile is all about change management.  As with any change management you need to look to the mindset of the people that you wish to influence and find out what barriers exist and what prizes can be had for those that endorse the change.  Each person on the team or from a management position is coming from their unique perspective.  Typically, we see patterns of behavior that enable grouping of these perspectives. 

  • Converts
  • Cowboys
  • Curmudgeons
  • Control Freaks

I’ll start with the easiest group:

Converts

They have already drunk the kool-aid.  They recognize that what has been going on in the past has not been working all that well and welcome the change.  There is no need to continue to try to convince this group.  Instead do what is necessary to keep them from getting frustrated and focus on harnessing their passion and leverage it into convincing others. This group is your ally.  Keep up their passion and leverage it, but don’t spend too much time preaching to the choir.

Cowboys

This group doesn’t need no stink’n process.  They have the mindset that if management and process would just get out of their way then they would be able to work wonders.  Sometimes there’s some truth to what they say.  More often than not, however, the result of cowboys let loose is a chaotic train wreck. 

How to approach this group depends on where your organization is coming from.  If your starting point is perceived by the cowboys to be a stodgy bureaucratic process, then most likely the cowboys can be won over relatively easily by convincing them that agile development is a far lighter weight process and is designed to allow them to flourish.  The danger here is that it is too easy for a cowboy to look into agile only to conclude with “yippee yi yay—I told you that all this documentation was crap.”  So, while it may be possible to get them to convert, the effort needs to be on maintaining their discipline and keeping their focus on value delivery.  The key here is the focus on “potentially shippable product.”  If a cowboy mindset can become “test infected,” then you have an incredibly powerful agile developer. 

Now if your cowboys have been allowed to live like free range chickens, then your problem is quite different.  The challenge is that the cowboys like having free reign, and will often see any process, even an agile process, as an unnecessary constraint and bureaucracy.  If this is your environment and you want to win over the cowboys, keep things light and look for areas where everyone agrees some improvement could be made.  Usually there is something from the agile toolkit that provides a good solution for that area, so emphasize that aspect and gain success to begin to win over some converts.  A common issue with a cowboy dominated culture is quality.  If that is the case for you, then look to introduce practices such as test driven development or just work on truly getting to “done” so that you have a potentially shippable product at each iteration.

Curmudgeons

This group just doesn’t like change.  The old way may not have been optimal when they started using it, but they’ve been doing it long enough now that they think they know how to do it and every time they tried something it has failed (often because enough of them have sabotaged it to make it fail).  This group is dangerous if they really are willing to sabotage the effort.  They can be very difficult to win over.  They see a big prize in keeping things the status quo, and/or are threatened by any change.  The first thing to do is to find out what is the prize that they are holding onto and what are their fears.  If your curmudgeons are intractable with their position, you may need to look to move them off the team or to sideline them so that they are not causing problems for the team.  Ultimately many of them will convert, but they will typically be the last to convert.

Control Freaks

This is the group that typically has the biggest mindset misalignment with agile development.  Unfortunately, the corporate world is often driven by this mindset and as such many senior leaders get promoted based on the perception that they are able to bring control to chaotic environments.  Software development has inherent uncertainty, much more uncertainty than even those within the industry care to acknowledge.  Control freaks don’t like uncertainty.  Uncertainty is a problem.  They don’t like problems, they want solutions.  Detailed plans give them the illusion of control.  Ignoring the uncertainty is a convenient way for it to go away.  Their mindset is that prior projects have been unsuccessful because they did not do enough up front planning.  If only we had spent more time up front we would have learned everything.  It makes a lot of sense, especially in a linear world of thinking.  The problem is that it just doesn’t work.  There are some things which are just fundamentally unknowable until the solution is further evolved.  Frederick Brooks called this the werewolf in his famous essay “No Silver Bullets.”   The irony in the situation is that agile development actually provides more control of the software project than one gets with a detailed upfront plan.  The difficulty is convincing the control freak of that fact. 

Often control freaks can be convinced to try things out, especially now that agile development is getting more mainstream.  After all, there are a lot of things about agile they are likely to endorse.  Agile development focuses on value and how to deliver value effectively.  They will typically like the concept of user stories and planning associated with task breakdown.  They will also get behind the focus on quality and the drive towards a potentially shippable product.  It may be possible to convince some control freaks that agile development is actually more disciplined than where they have been. 

Some common problems with control freaks that start the transition to agile is their tendency to over-plan and their unwillingness to allow the team to self organize.  One common over-planning behavior is the desire to take the entire backlog and allocate it out to iterations all at the beginning of the project.  This is can range from being a potentially harmless waste of effort to being quite dangerous if it also sets expectations that such a detailed plan will actually be followed.  Control freaks must get satisfied that they are doing enough detailed planning.  Try to keep them focused within the iteration and help them avoid their tendency to want to plan everything in detail.  Get to the heart of what they are trying to control.  Probably they feel they need a detailed plan so that they can give predictable answers when questioned.  Help them learn that questions are best answered when there is sufficient knowledge to answer them, and that agile development will surface that knowledge.

Perhaps the biggest problem with control freaks is that they can often get in the way of allowing the team to self organize.  If the control freak is in a management position this can be particularly challenging.  If you are in a position of leadership yourself, then you can sometimes minimize this issue by shielding the team from the control freak.  It puts extra burden on you, but makes the team far more effective.  If the control freak is inside the team then the team needs to work together to help them get over their concerns.  If the team cannot band together to deal with this then it is unlikely that they are going to get much traction on the issue.

Further Reading

For further reading, I recommend a book “Fearless Change: Patterns for Introducing New Ideas” by Mary Lynn Manns and Linda Rising

Posted in Uncategorized | 2 Comments

Welcome to Todd’s blog

Welcome to Todd’s blog.

Posted in Uncategorized | 1 Comment